
 October
And the trees are stripped bare
Of all they wear
What do I care ?
Words and music by U2, October 1981.

A lot can change in just twentyfive years. And this year, the trees aren’t bare, or even brown.
This October is different, because all the trees are green.
 Who knows what the world will be like in another twentyfive years ?
But we know that answer already: October will be just another summer month.
As it already is in England, right now. Today.

Related articles:
133. Tomorrow – Avril Lavigne and global warming
69. Running low on fuel
105. A crisis of energy
110. The hands that built America – Houston skylines
43. A sense of time – Earth history and the London Marathon
75. The Cruel Sea – the Indian Ocean tsunami


Sing it, brother! Winters, here, are nothing like they used to be. Despite that, despite all of the evidence, the oligarchs of Korporate Amerika prefer to keep their heads stuck in the sand (or, perhaps, elsewhere…)
This marks something of a tipping point in perceptions on this side of the Atlantic. The report was commissioned by government, and it wasn’t written by an environmentalist.
Nicholas Stern is a former Chief Economist of the World Bank.
Hi: I am a PhD researcher at CCSR, University of Manchester, England, sponsored by the ESRC and Office of the Information Commissioner, UK. Part of my research comprises an online (confidential) survey of attitudes to privacy in online publishing. Please click to take part – answers will be analysed to inform academic and policy discussions. Many thanks.
We had a warm spell a week or so ago – 75 degrees (Fahrenheit) in November. It was kind of nice, but creepy too.
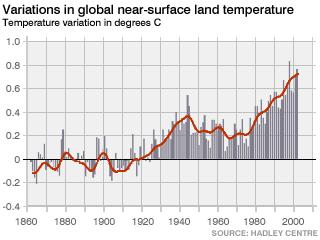
Your middle graph stops at 2000 & shows 1998 as the warmest year.
It still is.
Catastrophic warming seems to have stopped.
December 2007 was the coldest month since 2000. Solarcycle 23 seems to get a all time high in duration for the last 200 years. It seems to increase from 10 to 12.5-13 years. Last time that happened, Dalton minimum, the global temperature droped 0.2-0.4 degrees.
The temperture started to drop at an increased rate during 2007.
Did carbon dioxide stop causing global warming since 2000 or what is wrong?
I can tell you the answer, it is the sun to blame for the drops and raises in temperature we have seen the last 150 years.
Your graphs are using urban polluted groundbased thermometer data which give too high temperatures.
For accurate temperatures since 1979 check RSS satelite data that do not suffer from such problems. The satelite data shows only half of the warming that the urban poluted thermometers give.
See
http://www.worldclimatereport.com/index.php/2008/01/08/musings-on-satellite-temperatures/#more-298
Jerker
Thank you for your comment. Thermal insolation most certainly has an effect on climate, and I agree that it needs to be considered in any analysis of temperature variations over time.
This is to some extent the essence of James Lovelock’s argument. But whilst insolation does indeed vary as a result of oscillations in the Earth’s orbit, it does not vary nearly enough to explain the temperature variations which have been observed. There is a good and very clear analysis in this article:
Climate change in the public debate.
Your implication that rigour is required in reviewing temperature datasets is entirely correct. The collation, comparison and analysis of meteorological records go to great lengths to remove artefact anomalies caused by the so-called ‘heat island’ effect resulting from increased urbanisation.
This effect may be evident from a comparison of temperatures recorded in rural sites with those measured in city streets and urban back gardens. If not adequately stripped out of the data, then comparisons over time would no longer be valid and erroneous conclusions might be reached.
It is also true that the weather we experience in different locations varies from year to year and from month to month. It would be scary in the extreme if every year were indeed relentlessly warmer than the last – as seemed to be occurring within the 1990s. However, it would now appear that this intensely worrying acceleration in global temperature rise occurred because of a pronounced positive reinforcement of the insolation and anthropogenic climate change effects during those particular years.
Nevertheless, there are many readily observable aspects of climate change which go far beyond the temperature in anyone’s back garden, or the scope of a cold snap in any single December.
The systematic and progressive retreat of the Arctic ice cap is just one of those. I’m very short of time today, so please forgive me for simply quoting Wikipedia, which presents the facts clearly and unequivocally:
“Already in early August 2007, about a month before the absolute minimum was expected, new historic Arctic sea ice minima were observed.”
“Around September 16, 2007, a minimum area of 2.92 million km² and minimum extent of 4.14 million km² were reached.”
“These numbers shattered the previous (September 20 2005) record absolute minima; the 2007 minimum extent was 22% or 1.19 million km² smaller (approximately the size of Texas and California, or five United Kingdoms, combined) and 41% below the 1978-2000 average summer minimum [1].”
“The area was even 27% below the previous record and 46% below the average, reflecting the poorer quality of the remaining ice packs [7].”
“The northernmost ice edge ever was recorded in September at 85.5 degrees North (near 160 degrees East), i.e. just 4.5 degrees from the North Pole.”
[please note that the footnote numbers refer to references from the primary scientific literature, as cited in the full article Polar ice caps]
And if you still want to tell me that such records are consistent with falling global temperature, or are in some way related to local urban heat pollution effects, then I’m afraid you’re really going to struggle to convince.
Hi Roads, I did not expect to get a reply in this thread that fast as it looked quite sleepy atm.
We have to get a few things clear.
Clamat change is NOT equivalent with the greenhouse effect or global warming.
Greenhouse effect CAN cause those things, just like the sun can.
The question that has been asked more frequently the last years is how big the greenhouse effect actually is and how much of the global warming it is resposible for.
New scientific studies like http://www.tmgnow.com/repository/solar/lassen1.html shows that there is a strong relation to the solar cycles length and temperature raises and drops. IPCC for example give such results a minor or none significance in their models for earth climate.
Raising temperature and melting ice cap is to be expected as ice melt at higher temperatures. It seems like the northern part of the Earth is more sensitive to climat changes than the southern part. Even if the temperature is falling atm we are still at high temperatures and climat changes rarely come very fast, it takes decades to get descent trends.
For example the raise of global temperature until 1945 could hardly be caused by CO2 due to the small increase until then. It can not be caused by a temporarily weather phenomenon since it lasted for over at least 40 years. Something else made earths temperature raise decade after decade.
Something was clearly adding energy to earths atmosphere. We all know that energy can not be created or destroyed so the energy must come from somewhere, that only leaves the sun left to blame.
When we have a global warming period it seems to raise much faster in north and when we have global cooling it drops more than the global average.
See the years from 1945-1975 where we suffered from a global cooling allthough the CO2 raised at a faster rate for each year.
You can see it in the world map diagrams on the page below.
Unfortunatley it is in swedish but the world map diagrams are from IPCC and shows how earth is much more sensitive for cooling and warming up north.
http://www.kolumbus.fi/larsil/warming.html
Melting ice cap is not a sign of greenhouse effect it is a result of raising temperatures.
Raising temperatures CAN be a sign of greenhouse effect which I belive is minor.
Reason for this is if you check studies of relationship with solar activity and the temperatures for the last 400 years there is a strong relationship between them. Long before CO2 could have any effect on the climate.
We had increasingly stronger solar cycles during the 20th century with a weaker one around 1975 that fits very well with the temperature curve.
I belived fully in the theories that CO2 has caused a global warming and will do so at even higher rate until the beginning of 2007. Thats all the information I got via newspapers. Noone where reporting anything else even though studies had existed for decades that strongly contradict such theories.
As I started to dig deeper in the subject I noticed more and more results that showed that most of what we are experiencing now is caused by natural variations on the sun. Eventually the evidence where so many and strong that I changed my mind in the subject.
I think it is sad that ppl are denied to make their own opinion about the subject due to media almost only write articles about global warming and climat change as it was exactly the same as greenhouse effect. Most ppl I know that do not have knowledge about the suns effect on earths climate. They belive that if the temperature gets higher it is 100% sure it is caused by raising CO2. They are not aware that earths climate can vary alot during the centuries.
Sorry for the long post but it is an important matter that needs to be discussed throughly.
Thank you for that link btw, it was one of the more balanced articles on the issue I have read so far. It had information I had problems to gfind before such as how much natural variations have been affecting climate if the green house effect that IPCC predict is removed.
Jerker
Thanks for taking the time to reply. I’ll have to check out your links later.
You are correct that the issues here are simplified by the media, but it’s also true that the so-called “climate change deniers” have twisted and manipulated the presntation of facts to fog the issues, which are complex in detail but remarkably straightforward in their importance and alarming implication.
I think we agree on this: that global temperature is affected both by insolation and CO2 levels.
What we disagree on here is the relative scale of those effects.
Interestingly, both of these effects have influenced global climate across the vast expanse of geological time.
There is a very clear reflection within the geological record of periods when CO2 concentrations were high (greenhouse world) and periods when CO2 was low (icehouse world).
Likewise, subtle and cyclical changes in the Earth’s orbit with a range of different periodicities (the so-called Milankovitch cyles) have controlled systematic variations in environmental conditions which can be recognised within repeated cycles in the rock record.
Examples may be found within the thick sequences of alternating limestone : shaly limestone bands which are so characteristic of the Lower Jurassic and Upper Cretaceous in NW Europe and eastern North America.
The crux of the matter centres around the different timescale and magnitude of these processes within recent times.
The insolation effects (once dominant, prior to the Industrial Revolution) now increasingly manifest themselves on the global temperature curve as (relatively) low level ‘noise’, superimposed on the larger (and increasingly large) effect of rising anthropogenic CO2.
Imagine adding a low amplitude sinusoidal wave (representing the insolation effect) to a progressively steepening quadratic curve (recording the CO2 effect) and you will more or less exactly mirror the observed global temperature curve.
The corrugated (if still steepening) form of this composite curve also provides the explanation for why the observed rise in global temperature is neither precisely uniform nor perfectly described by comparison with the CO2 curve alone.
As you note, at some times (1990s, 1900-1950) the observed rapid global temperature rise reflects a positive reinforcement of CO2 and insolation effects, whilst at others (from 1950-1975, for example) the insolation effect acts as a partial counterbalance to the CO2 rise and global temperature remains relatively static or may even fall slightly.
Nevertheless, the CO2 contribution is becoming increasingly strong over time, as atmospheric CO2 levels continue to rise and as this rise continues to accelerate (global CO2 concentrations have risen by well over 20% since 1958).
The stark fact is that we have never in the geological history of this planet witnessed such rapid and significant change in global temperature as we have observed over this same period.
The various temperature graphs within my 2004 post 69. Running low on fuel serve to illustrate this critical difference of relative timescale and magnitude both clearly and very dramatically.
Thank you once again for your constructive discussion.
Hi!
The ice core data that show CO2 and temperature levels is analysed by NOAA in the following way:
“Air trapped in bubbles in polar ice cores constitutes an archive for the reconstruction of the global carbon cycle and the relation between greenhouse gases and climate in the past. High-resolution records from Antarctic ice cores show that carbon dioxide concentrations increased by 80 to 100 parts per million by volume 600 +/- 400 years after the warming of the last three deglaciations. Despite strongly decreasing temperatures, high carbon dioxide concentrations can be sustained for thousands of years during glaciations; the size of this phase lag is probably connected to the duration of the preceding warm period, which controls the change in land ice coverage and the buildup of the terrestrial biosphere.”
See link http://www.ncdc.noaa.gov/paleo/vostokco2.html
You can also see a more detailed diagram showing that CO2 raises or stops raising after the temperature changes at this site that is about the problems of the greenhouse effct.
http://www.daviesand.com/Choices/Precautionary_Planning/Closer_Look/index.html
This page is not Co2 sceptic page.
About the rapid raise in temperature. You say that we have never seen as rapid change in temperature before. Where have you got that information? As far as I can see by analysing data since the last deglaciation there have been much more rapid changes than we suffer from now.
I downloaded vostok ice core data and made a diagram in excel that shows how fast the temperature has changed for the last 100 years for each sample point.
It shows that a change up to 3C/100 years has happened since the last deglaciation.
Temperature changes of 1C/100 years is common and changes of 0,5C/ 100 years is very common.
We are atm noway near the upper limits of natural temperatur changes yet, but that is offcource not a proof that there is no or very little anthropogen warming atm.
I have uploaded a picture of the diagram at the folowing place.

Interesting stuff, Jerker.
The links you provide illustrate the classic ‘hockey stick’ in CO2 and temperature. There have been some fairly rapid temperature swings in the past, notably at the end of each of the Ice Ages, but I’d disagree with you about the frequency and especially the duration of sustained temperature shifts at 3C per hundred years.
You are correct to note that in the past there have frequently been delays between changes in temperature and CO2 levels.
We may suppose that the temperature changes seen during the Holocene (from the modern period extending back 2 million years or so to include the ice ages, more or less) were likely caused primarily by natural changes in insolation.
As temperatures rose or fell in response, then the change in CO2 levels which followed was often subject to a delay as the Earth’s vegetation adapted to new conditions – either by growing new forests as the world became warmer, or by killing them off as the Earth cooled.
There is likely also to have been a buffering effect on CO2 concentrations caused by absorption of excess CO2 within the ocean waters as well as in the calcareous shells of marine organisms (molluscs, corals and the like).
Unfortunately for us, we can’t realistically rely on such natural compensations to save us now. The rapid rise of atmospheric CO2 over recent years puts the capacity of the oceans to absorb more in serious question.
The indications are that ocean pH has fallen in recent years (the seas are becoming more acidic as a result of absorbing CO2), and the evidence is that many marine wildlife systems, including coral reefs, are struggling to adapt (that may be a euphemism for ‘being systematically destroyed’). Far from absorbing more CO2 to compensate, the implication is that the oceans will absorb less.
Likewise, the increasing rate of global deforestation is such that the potential for excess CO2 to be taken up by biomass has been dramatically eroded – in fact the burning of rainforests releases large quantities of additional CO2 into the atmosphere, serving to exacerbate our problems.
The geological dogma that ‘the past is the key to the present’ may no longer apply here. Because we aren’t in this scenario looking at rising CO2 in response to warmer temperatures (as has often occurred in the past). That’s not what is happening now at all.
Rather what we are seeing is the forcing of warmer temperatures due to a dramatic release of CO2. We are hell-bent on burning 200 million years of carbon budget within a century or so, by using up our oil and gas and coal at a very rapid and increasing rate.
The rise in temperature that we have seen is relatively modest so far (fortunately) but it is still remarkable on a personal and human scale.
In part, no doubt, this may reflect the capacity of the natural environment (up to now) to buffer some of the effects of rising CO2, up to a certain point. There is also a lag, as you point out, between cause and effect. Put simply, it takes a planet some time to heat up if you place a blanket around it.
The flip side of this delay, however, is that the effects of elevating CO2 concentrations to their present levels will now continue to be felt for centuries to come.
The IPCC reports estimate that world temperature is likely to increase by somewhere between 1 and 6C over the course of this century, depending on the action of positive feedbacks, and other measures such as protection of the rainforests.
A fascinating recent book, Six Degrees examines the effects on our world that this kind of temperature rise will have.
The conclusion is that the middle part of that range is extremely problematic, and the upper part has the potential to be devastating for much of life as we know it on this planet.
Of course, we could just let that happen – it would be a fantastic scientific experiment to see just how much (more) of the planet’s ecosystem will be destroyed if we take no action to prevent it.
And as things stand, that is exactly the experiment we are running.
No need to agree with me about how much the temperature changes have been since it is not I who have recorded the data. Its all there in the vostok icecore data.
See:
ftp://ftp.ncdc.noaa.gov/pub/data/paleo/icecore/antarctica/vostok/deutnat.txt
Notice this is the data that Al Gore, who got the Nobelprise, used. So they must have some significance right?
For example check the following years in the data set:
Depth corrected Ice age (GT4) deut deltaTS
86 2805 -441.7 -0.61
87 2847 -434.5 0.58
88 2889 -440.3 -0.38
89 2934 -446.1 -1.34
Notice how temperature raises from -1.34 to 0.58 C = 1.98C in 87 years. That equals 2.3C/100 years.
Also notice how the temperature then drops 1.19C in 42 years which equals a rate of 2.8C/100 years.
The problem as I see it is to proove how much CO2 actually has raised.
I have seen calculatiosn from anything between 0.3-0,4C if CO2 raises with another 200ppm and IPCC worst case scenario with 5.8C raise.
Atm I am much more concerend about the problem we may encounter the next 2 decades if the sun goes into a Dalton minimum which it looks like at this time. Last time, in the 1790s, earth entered a several decade long cold period which made the end of the 1800th centure look like a strong global warming.
I new Dalton minimu wil strike us extra hard up in northern part of the world since that area seems to be more sensitive to changes.
A new Dalton minimum is expacted to push down earths average temperature by anything from 1.2-1,9C if I remeber the numbers right.
Such a rapid drop will have a severe impact on the amount of food we can produce. 1790 we had about 1 billon to feed, today we have over 6…
The key issue which we must not forget here is that anthropogenic CO2 production is not a naturally cyclical phenomenon.
It is a one-way process, which continues to accelerate. There is no downward section in this curve as it is currently configured.